 |
| Life Expectancy Map |
Overview
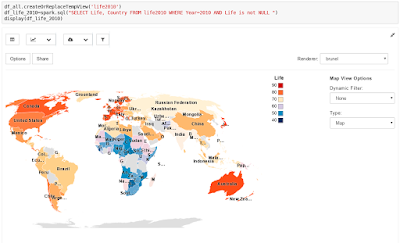
In the tutorial, you are going to use IBM Watson Studio to organize all required resources. Watson Studio serves as glue around the data, cloud object storage, Apache Spark as compute platform, and Jupyter Notebooks. A notebook is an open-source web application that contains live code, equations, visualizations and narrative text.You are going to combine open data about country population, life expectancy rates and country ISO codes. First, data is loaded into so-called data frames. Then, because data from different sources may have a different format, you tranform the frames. Thereafter, analyze the data using SQL. By utilizing the PixieDust library, even visualizations are easily done. The screenshot shows how life expectancy rate be country can be depicted on a zoomable map.
Conclusions
With few steps, you can retrieve open data sets from different sources. Then, combine and analyze them in a Jupyter Notebook in Watson Studio and visualize the data. Try it yourself by following this tutorial “Analyze and visualize open data with Apache Spark“. Also, check out the other IBM Cloud solution tutorials in the IBM Cloud documentation.If you have feedback, suggestions, or questions about this post, please reach out to me on Twitter (@data_henrik) or LinkedIn.
(This blog entry was first published on the IBM Cloud blog)